A forecast is simply a prediction of what may happen in the future. Regardless of the multiple techniques available, it is near impossible to develop a perfect forecast.
Forecasting methods are qualitative or quantitative. Qualitative methods involve the use of expert judgment to develop forecasts. We use it in case of corresponding historical data is either unavailable or not applicable.
Quantitative forecasting is applicable, when:
· Past data is available
· Information can be quantified
· and it is reasonable to assume that the pattern of the past remains unchanged.
What is a Time Series?
A time series is a sequence of observations at successive points in time or over consecutive periods. The measurements can be of every hour, day, week, month, year, or any other regular interval.
The objective of time series analysis is to understand the pattern in the time series and then extrapolate the model into the future. The forecast is based solely on historical values or past forecast errors.
Another popular method is causal or exploratory forecasting methods. It assumes that the variable we are forecasting has a cause-effect relationship with one or more other variables. For example, the sales forecast depends on the advertisement. In such cases, a prediction model using regression analysis can forecast future sales amount depending on the advertisement budget. Note that if we use a time series method for the forecast, we ignore the advertisement budget.
The time series method calculates the forecast solely on past sales values.
Time Series Patterns
The first step is to visualize the data using a time series plot. It helps in understanding the underlying pattern. The time series plot is a graphical representation of the relationship of time with the variable we need to forecast. The horizontal axis represents time, and the vertical axis represents the time series variable. As a convention, we use a line chart for the visual representation of a time series.
Horizontal Pattern
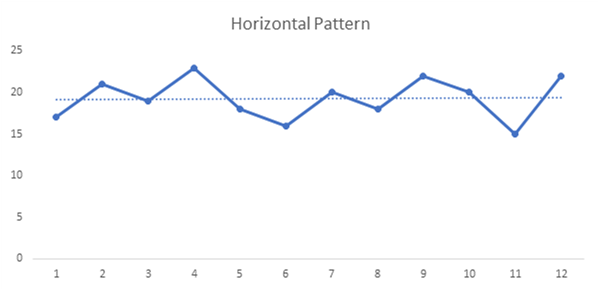
A horizontal pattern exists when the data fluctuate randomly around a constant mean over time.

Sometimes, changes in a condition often result in a time series with a horizontal pattern to shift to a new level at some point in time. For instance, the startup in the earlier example has added a new location in week 13. With this change, the sale volume has a notable change starting week 13.

This type of shift is also known as the new normal.
Trend Pattern
Usually, time-series data exhibits random fluctuations. It may also show gradual shifts or movements to higher or lower values over a period. Such behavior indicates trend patterns available in data.

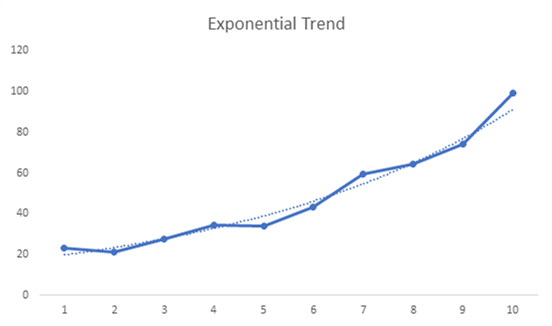
The time series plot shows some up-and-down movement over the period. It also has a systematically increasing or upward trend. The data point is changing by a constant amount from one period to another; hence the trend is linear.
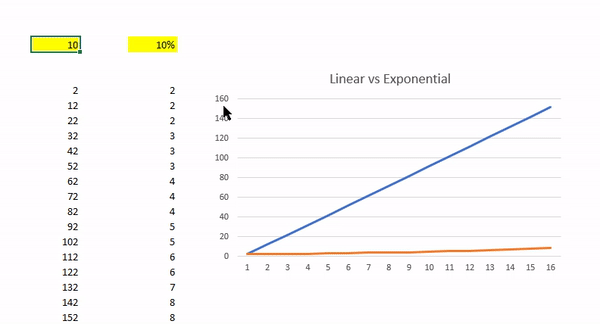
When there is a constant percentage change from one period to another, then it is an exponential trend.

The below image shows the difference between how exponential trend changes as compared to a linear trend. Series one is a constant increase from previous data point, whereas series two is a % change from the previous point.

A trend is usually a result of long-term factors like population change, a shift in demographic characteristics, improving technology, change in the competitive landscape, and/or change in consumer preferences.
Seasonal Pattern
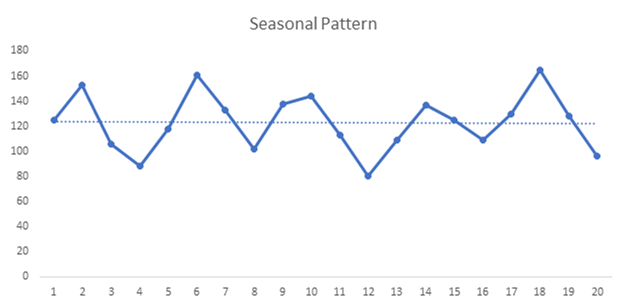
Seasonal patterns are recognized by observing recurring patterns over successive periods.
Seasonality is the number of time steps that it takes for a full data cycle, after which the cycle repeats throughout the time series.
For example, an electronic store expects the rise in sales of AC or air cooler during summers and room heaters during the winters. And this pattern repeats each year.

A general conception is that season pattern is evident in yearly data. However, time-series data can also exhibit seasonal patterns of less than one year in duration. For example, road traffic volume shows within-the-week, within-the-day seasonal behavior, with a repetitive pattern in the peak hours and off-peak hours.
Trend and Seasonal Pattern
Some time series includes both a trend and a seasonal pattern. For example, the time series plot indicates an increase in sales volume with a decline in the fourth quarter for each year.

Cyclical Pattern
A cyclical pattern exists if the time series plot shows an alternating sequence of points above and below the trendline that lasts for more than a year. Various economic time series show cyclical behavior with regular runs of observations below and above the trendline.
Business cycles are extremely difficult to forecast, if not impossible.
Finding Time Series Patterns
Finding patterns in a time series data is an essential factor for selecting the right forecasting method. If the data is showing a horizontal pattern, then we select moving average or simple exponential smoothing. Similarly, if the data exhibit trend or seasonality, we select the right forecasting techniques

Click here for articles on:
· Moving Average
Now we know a few more methods to forecast

Comments